Seeing the bigger picture: 6 ways IFAD uses GIS to optimize climate investment
IFAD Asset Request Portlet
ناشر الأصول
Seeing the bigger picture: 6 ways IFAD uses GIS to optimize climate investment
المقدر للقراءة دقيقة 7
Climate change is now our daily reality and poor rural people are bearing the brunt of it. But we still have a chance to mitigate its impacts. Climate investments today can reap rewards in the future, helping rural communities adapt and flourish in a world that’s ever more uncertain.
IFAD has a long track record of investing in the people at the frontlines of climate change. Most recently, ASAP+ aims to mobilize US$500 million in climate finance to help 10 million smallholder farmers become more resilient to climate change.
By drawing on local knowledge and using tools, IFAD decides where investments will best pay off. One of these tools is Geographic Information Systems (GIS). These systems make it possible to map project locations against satellite imagery, climate data and other geospatial information, like deforestation trends, to better understand where and how climate change is affecting smallholder farming, and what is needed to mitigate its effects.
Here are six ways IFAD uses GIS for effective climate finance:
1. Target areas most in need
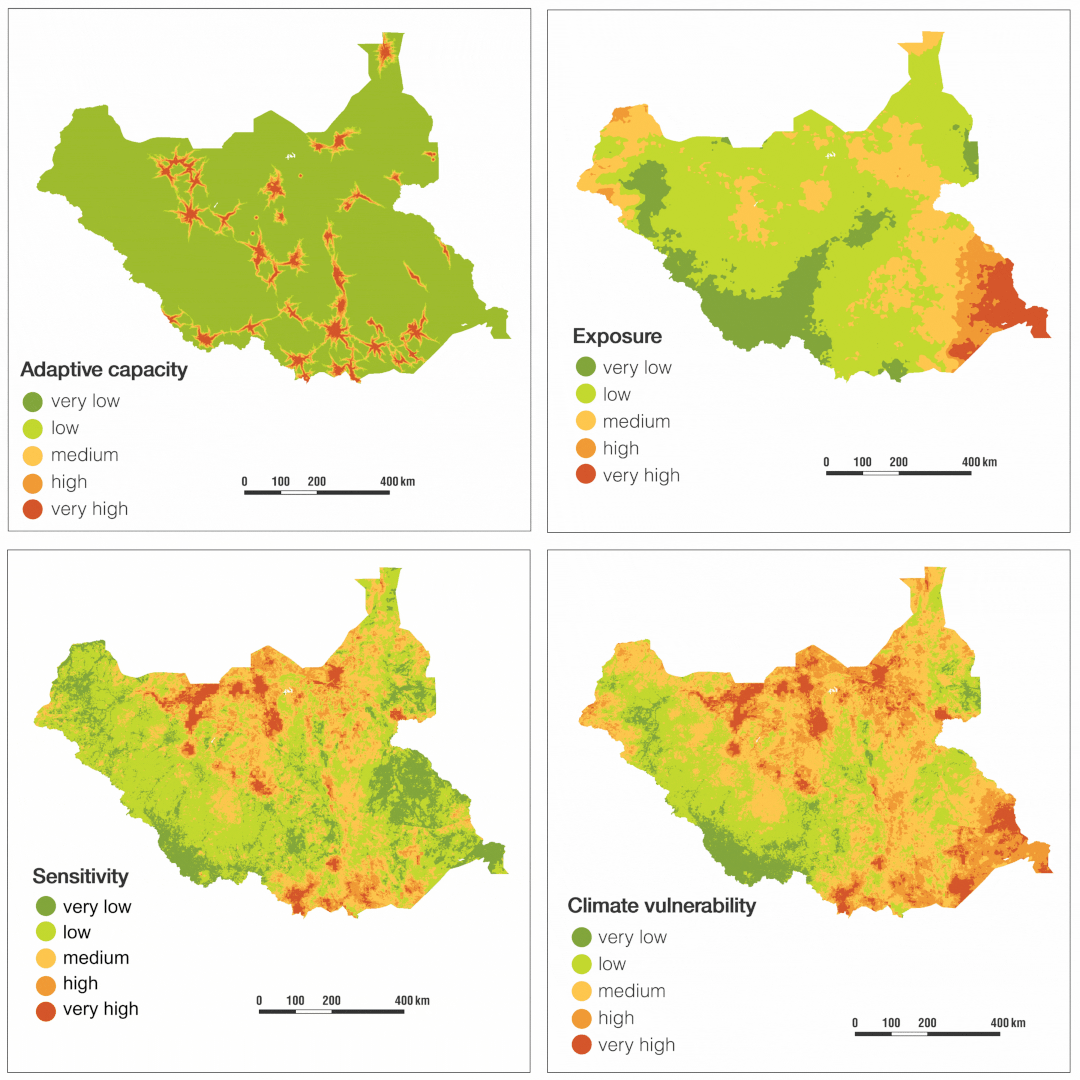
Climate investments have most impact when they reach the people who need them most. IFAD uses geospatial methods to identify the areas and communities that are most vulnerable to climate change by analysing:

sensitivity and adaptive capacity. Explore the results dashboard.
how sensitive a community is to climate change (e.g. if it’s located in a flood-prone area).
how exposed it is to climate change impacts (e.g. if the specific area is expected to flood more often due to climate change).
how much capacity it has to adapt (e.g. a remote community will find it harder to identify other sources of income so it has less capacity to adapt).
2. Identify the right approach
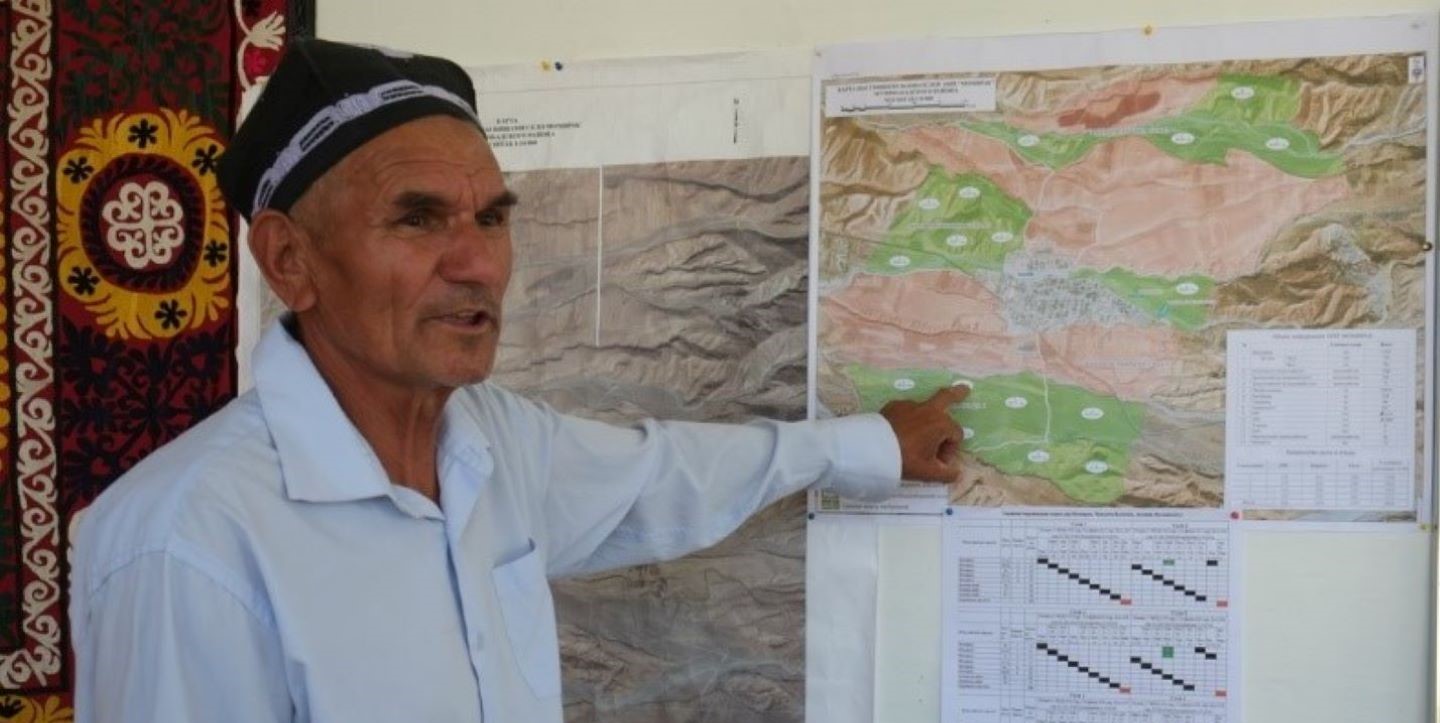
GIS helps identify the right intervention for the right place. For example, the ASHA project in Nepal combined local knowledge with GIS data to develop area-specific adaptation interventions, such as community infrastructure and afforestation to prevent landslides. By the end of 2021, over 21,000 hectares of land were managed using climate-resilient practices and agricultural yields increased by up to 30 per cent.
3. Map climate investments
Many IFAD projects use geotagging, placing precise geographical markers showing where activities are taking place. These are used to draw up maps to understand where work is being done and how successful it is.

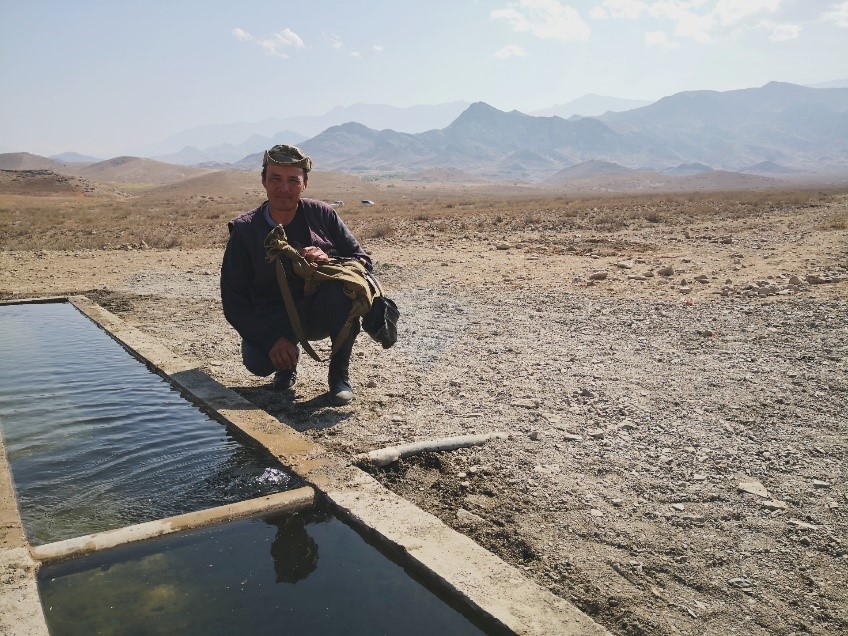
In Kyrgyzstan, IFAD-funded projects geotagged over 2,000 places where they had made investments in the livestock sector. Healthier animals can cope better with climate change impacts, like heat stress, while improved infrastructure helps communities move livestock and therefore manage the landscape more effectively.
4. Strengthen the land rights of vulnerable people
Many small-scale farmers don’t own their land, so they’re less likely to invest in it or adapt their farming practices so they’re more sustainable.
In Bolivia, the IFAD-funded ACCESSOS project demarcated and titled over 1.3 million hectares of land, benefiting 157 indigenous communities. These communities and other rural people worked with scientists to map the land’s natural resources in the past and the future to devise ways of managing it sustainably.
5. Assess impacts of climate investments
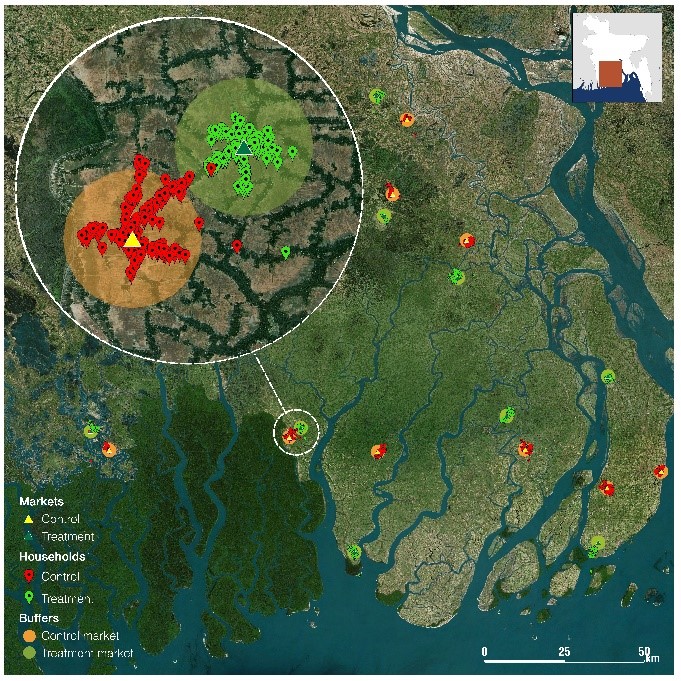
To understand if climate investments are making a difference in selected projects, on completion, IFAD staff survey households about their livelihoods and wellbeing, tag their geo-locations and collect other location-specific information, such as their climate histories.
In Bangladesh, evaluators tagged the GIS coordinates of markets where IFAD had invested in climate-resilient infrastructure, such as drainage and elevated roads in case of floods. They found that even during monsoons, households living near these markets earned 70 per cent more from crop sales than those living near markets without similar investments.

6. Partnerships for climate action
IFAD works closely with other institutions to collect data and devise innovative ways of using geospatial analysis.
For example, a study of an IFAD project in Kyrgyzstan conducted by the European Space Agency combined maps, satellite observations and site-specific data from FAO, NASA and NGOs to analyse changing pasture conditions. It found that 82 per cent of winter pastures and 40 per cent of summer pastures had been severely degraded since 2000 – findings that then informed Kyrgyzstan’s national climate policy.
With climate change intensifying, it’s now more urgent than ever to make climate finance available to help the rural poor adapt. Bringing together scientific data, local expertise and IFAD’s experience in rural development helps get the most out of these investments.
Explore IFAD’s catalogue of geospatial tools for climate investments.
Check out the GeoTech4Tenure IFAD-FAO training course.
تاريخ النشر: 01 نوفمبر 2022