Food biodiversity is the diversity of plants, animals, and other organisms
used for food, both cultivated and wild.
Crop species and varieties

Animals

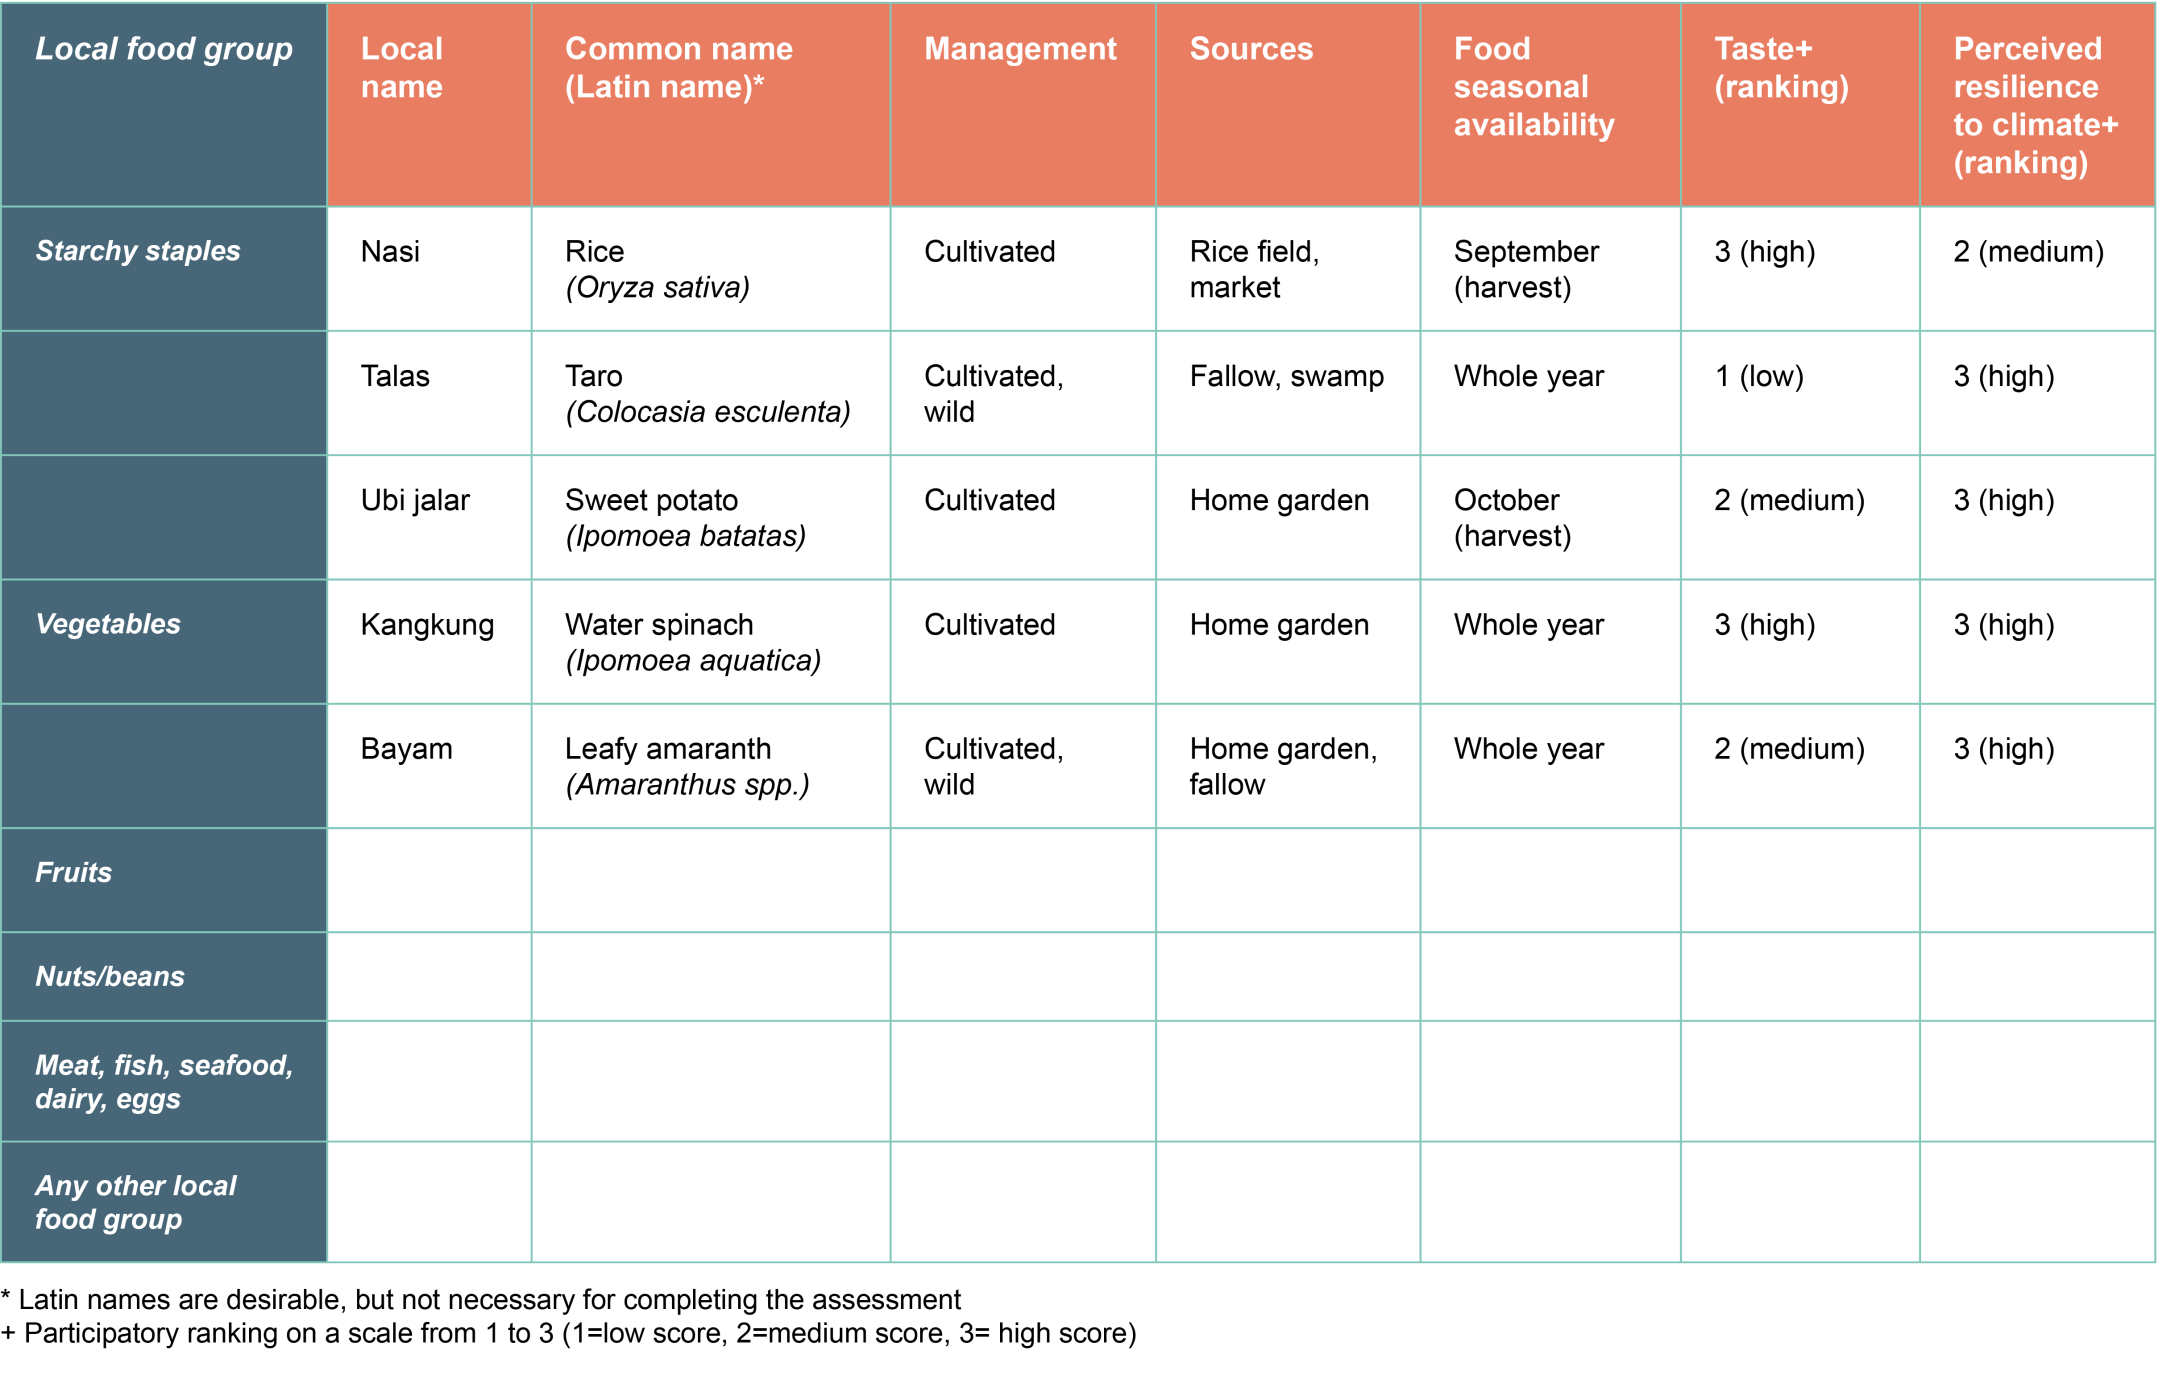
During data collection, a complete list of edible plants and animals occurring within the local food system should be generated through the free listing method with community members in a group discussion. The list should be comprehensive, involving plants and animals that are cultivated, purchased at market, and obtained in the wild. The list needs to capture neglected and underutilized species (NUS). While NUS may be neglected by research programmes and commercial enterprises, they often represent an important food source in IPFS. Additionally, the exercise should prompt for species that are no longer available (but could be revived). Data is collected in a table with local and common names and selected characteristics such as management, sources, seasonal availability, taste, and perceived resilience to climate change (Table 1). The plants and animals are listed according to local food groups (Box 1) or alternatively according to the management status (e.g., cultivated or wild), or source (e.g., home garden, rice field, fallow, forest, market).
Additional information of interest (such as key benefits/constraints) can be added as desired (examples of typical important criteria are taste, accessibility/availability, multiple uses, medicinal value, economic value, etc.). In this step, the listing focuses on local edible plants and animals; an overview of complex foods (e.g., soups, sauces, mixed dishes and food products) is obtained later during STEP 2 – dietary assessment. A deeper understanding of the local food system, beyond food species, is always desirable. See complementary methods.
Box 1. Grouping listed food biodiversity
Local food groups are folk categories of food biodiversity as perceived by the community. It is suggested to list plants and animals according to the local food groups and in local languages in order to enable easier listing for the community. An alternative approach would be to do listing according to the dietary diversity (MDD-W, see STEP 2 for a detailed explanation) food groups, but this approach is rooted in a "scientific" understanding of nutrition, and can be unfamiliar to local communities, thus resulting in a more time-consuming process.
How to organize and conduct a focus group discussion
A focus group discussion (FGD) is a facilitated discussion with community participants and possibly other local stakeholders. An FGD serves not only to get needed information but also to stimulate knowledge sharing among the participants. Typically, between 10-15 knowledgeable and active participants participate in an FGD. They can consist of mixed-gender stakeholders, if culturally acceptable, but gender-specific groups are recommended when women and men may not feel comfortable speaking equally and freely in a mixed setting.
Typically, the information is noted on a large sheet of paper visible to all participants (Figure 2). An FGD is conducted by a team consisting of a facilitator, assistant, and note-taker. The facilitator manages the discussion and creates a comfortable environment for all participants. The assistant’s and note-taker's roles are to support documenting the content of the discussion.
An FGD on food biodiversity in Indigenous Peoples' territories tends to take a long time (due to the high food biodiversity), therefore, it is important to organize the discussion with periodic breaks for refreshments. In the case of very long lists, there can be two sub-groups discussing species in different food groups or two separate FGD sessions.
Free listing is a rapid way to generate a list of edible plants and animals (and possibly also varieties/breeds if required, as different varieties or breeds can have different traits and benefits) available in the local food system. Listing should be accompanied by a brief characterization of plants and animals and group ranking of important characteristics such as taste, resilience to climate, and any other criteria of interest. Typically, ranking is done on a scale from 1 to 3 (1=low value, 2=medium value, 3=high value), but a 1 to 4 or 5 scale is also common.
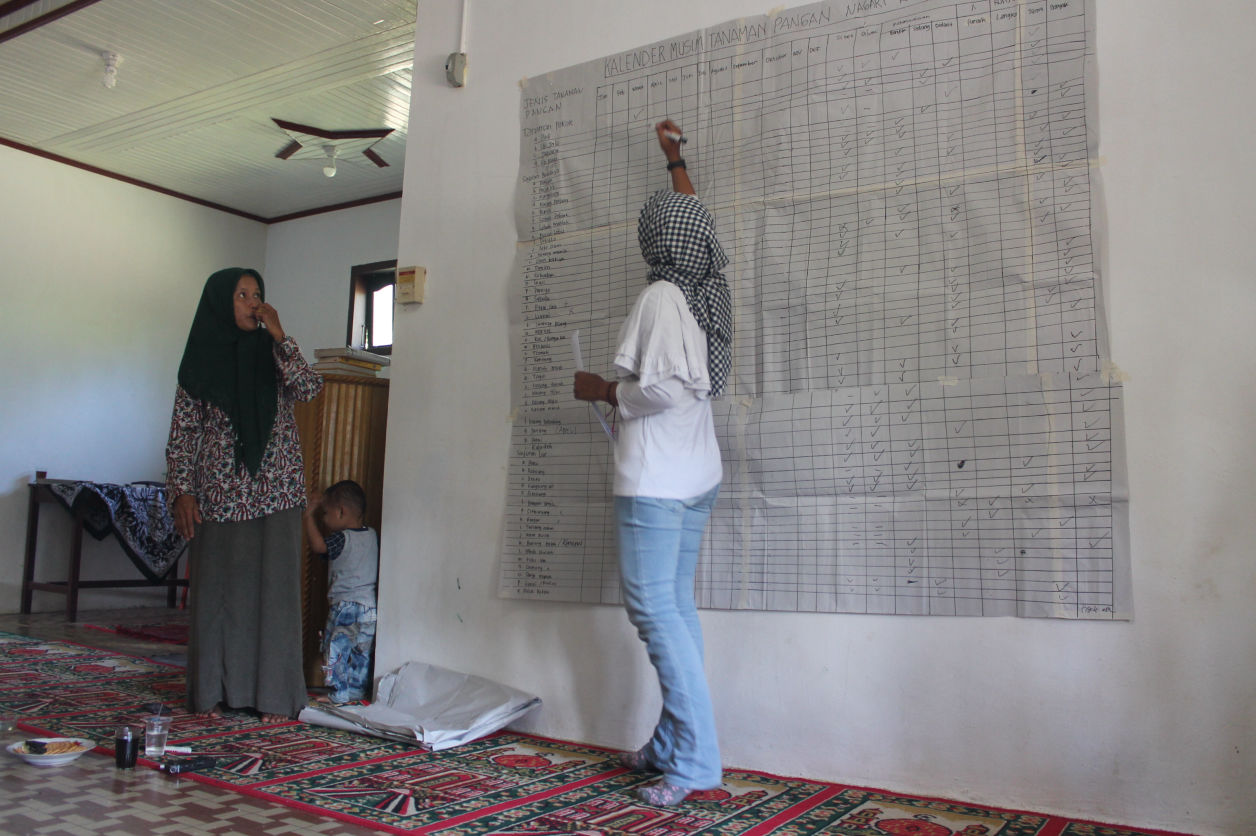
Figure 2. FGD facilitator filling in the table on food biodiversity in West Sumatra, Indonesia
Participatory food system mapping: Before creating a food list, participatory mapping of the landscape and food system (drawing a participatory map) helps visualize the entire local food system. It allows participants to point out and discuss all food sources, access to and governance of lands, and most important food system activities (Figure 3). This participatory map could also be used later during follow-up community consultations to discuss any related and important issues during prioritization of project interventions (STEP 3). The participatory food system mapping exercise is best done through a community workshop or transect walk.
Literature review: The existing information on local food biodiversity can sometimes be found in various literature sources such as research articles, reports, theses, databases, grey literature, etc. However, in the context of Indigenous Peoples’ food systems, the available information might be rather limited. Examples of relevant resources that include reference to Indigenous Peoples' food biodiversity are FAO and Alliance of Bioversity International and CIAT (2021) (10); and Kuhnlein et al. (2009) (1). And for an example of a regional food database, see a website by the CINE and Environment at McGill University (11).
Key informants' interview: Conducting individual interviews with knowledgeable community representatives (e.g., traditional knowledge holders, custodian farmers, heads of women's groups, cultural leaders) can be used to collect information on food biodiversity. Individual interviews are easier to organize than FGDs, but data analysis may be more time-consuming.
Household surveys: If a larger survey with multiple households is conducted, the inventory of food biodiversity can be collected at the household level and then merged and analysed.
Transect and agrobiodiversity walks: Observations involving local participants are a useful way to learn and document local food biodiversity across the landscape. Ideally, all local land-uses should be visited and both cultivated and wild food biodiversity documented. But due to seasonality, not all resources may be available in the given period. Therefore, the walks should be repeated in different seasons, or participants should be asked to recall food biodiversity available in other agro-climatic seasons.
Market surveys: Local markets are places with a high concentration of food biodiversity. Therefore, observation and survey of markets can generate a comprehensive list of foods available in the given season. Prices of foods can also be easily collected at this time. Like transect and agrobiodiversity walks, market surveys should also be repeated in different seasons or complemented by interviews to capture seasonal variation.
For more details about these additional methods, consult PAR (2017) (12), Kuhnlein et al. (2006) (13), IFAD and Bioversity International (2021) (14), ethnobotany manuals (15). Mijatovic et al. (2019) (16) provide a more detailed participatory assessment to leverage agrobiodiversity for climate change resilience and adaptation. The information on seasonality can reveal plants and animals with longer availability across the year (and thus providing a greater opportunity for consumption). See Lochetti et al. (2020) (17) for guidance on seasonal food calendars for nutrition.
For more thorough assessments, also consider photo-documentation and taxonomical identification of local species (15). Photos can be handy for later communication materials, while taxonomical identification would help to identify particular species and to check their management, conservation status, or food composition in the literature. Additional relevant manuals are available in the Resources section of the toolbox.
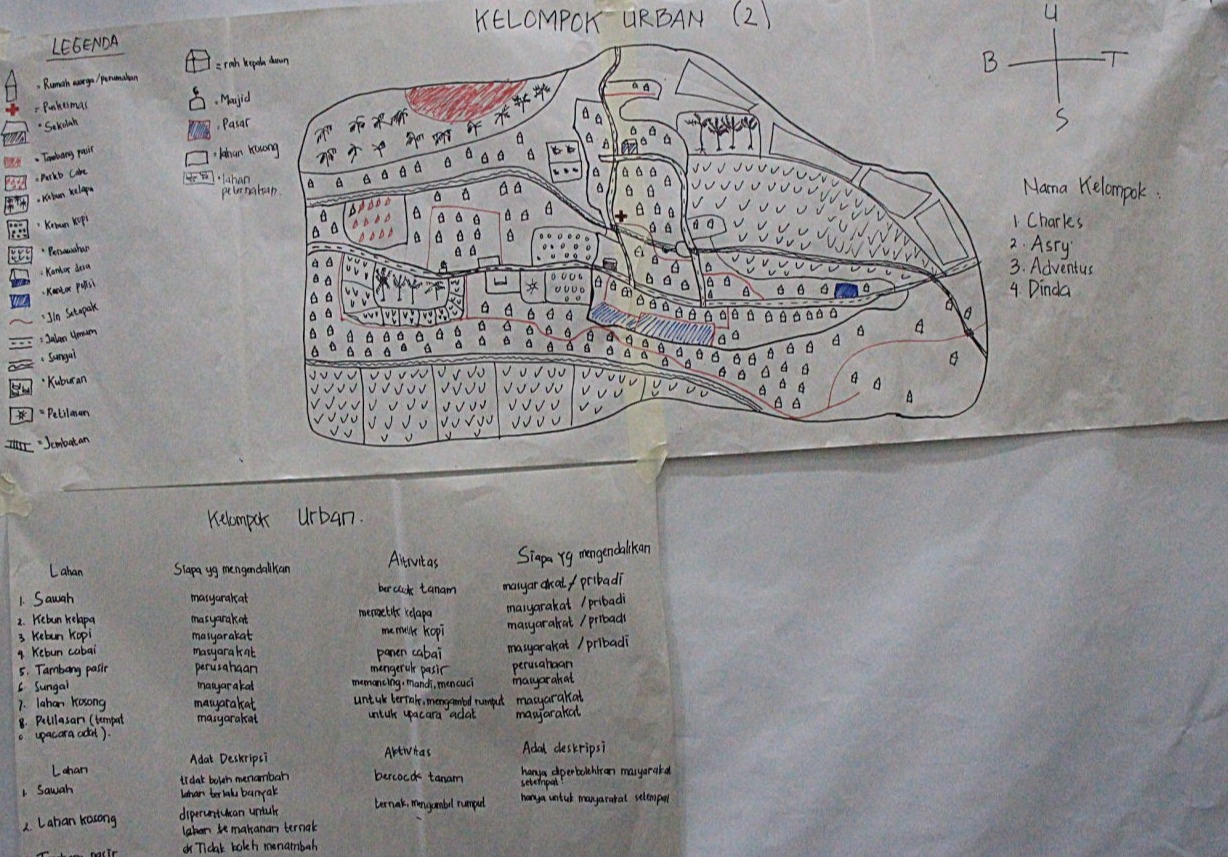
Figure 3. An example of a participatory food system map. The map includes key components of the village (houses, school, road, markets etc.), and surrounding land-uses such as rice fields, vegetable plots, agroforestry gardens, and rivers. The legends on the left side explain the features on the map, and the notes below the map list the main land-uses, who accesses and governs them, and what are the most important agricultural and food system activities.
1.2.1 General Data Analysis Following the Local Food Groups
General data analysis using the local food group categories is recommended but optional.
In general data analysis, the collected data should be transcribed into a spreadsheet. This information can be used to calculate:
- the total number of edible plants and animals;
- their number/proportion in particular food groups;
- number/proportion of wild, cultivated, and purchased food items;
- plants and animals with the highest ranks for taste and perceived resilience to climate change (and/or other criteria of interest).
However, it is important to categorize and analyse local food biodiversity following the Minimum Dietary Diversity for Women (MDD-W) food groups (see 1.1.2 below).
1.2.2 Categorization and analysis of food biodiversity following the Minimum Dietary Diversity for Women (MDD-W) food groups
All documented plants and animals should be categorized into the ten food groups defined by the Minimum Dietary Diversity for Women (MDD-W) (18, 19), in order to understand how local food biodiversity can contribute to a diverse diet and improved nutrition.
Similarly, general biodiversity and preferred plants and animals can be determined by calculating:
- the number/proportion of identified foods across MDD-W food groups;
- the highest-ranked plants and animals (sum of ranks of taste and climate resilience in the presented case) within particular food groups.
Box 2 provides an example of key findings from a food biodiversity assessment from the Solomon Islands.
Box 2. Example of key findings from the assessment of food biodiversity in the food system of Indigenous Solomon Islanders in Baniata village, Rendova Island.
A study by Vogliano et al. (2021) (20) documented 221 species and varieties of cultivated and wild foods in one rural village in the Solomon Islands. The most diverse groups were Meat, poultry and fish (69 species and varieties); followed by Grain, white roots and tubers, and plantains (47); Other fruits (46); Dark green leafy vegetables (26); Nuts and seeds (15); Other vegetables (14); Eggs (8); Other vitamin-A rich fruits and vegetables (5); Pulses (1); and Milk and milk products (0). (The study followed a different categorization, hence the numbers presented here are after re-grouping foods into MDD-W categorizations). See also the study-related video capturing food biodiversity and its potential to mitigate malnutrition and climate change.


Made with
No Code Website Builder