The next step in the process is to assess dietary diversity and identify food groups that are under-consumed. Dietary diversity data collection is conducted through survey interviews with individual women (24-hour food recalls). In data analysis, MDD-W is used to calculate the proportion of women consuming a diverse diet (at least five out of ten defined food groups), and to identify under-consumed food groups – the dietary gap – that can be addressed by the food biodiversity identified in STEP 1. MDD-W is one of the outcome indicators adopted by IFAD in measuring nutrition sensitive agricultural projects, but alternative methods of assessing diets and nutrition, such as expert interviews or secondary data reviews, are also briefly explained.
Dietary diversity is measured by a qualitative 24-hour food recall, which is conducted in a survey with the community members in project target areas (FAO, 2021) (3). If resources and time are available, additional data can be collected and other indicators may be consulted. A deeper understanding of local food systems beyond dietary diversity is always recommended, and especially important when assessing diets of communities with specific dietary patterns such as animal-dependent communities (Box 1).
Qualitative 24-hour food recall consists of asking individual respondents to recall all foods and beverages consumed during the previous day and night (Table 2). Food recall should not be conducted during times of ceremonies or fasting to avoid recording unusual consumption. The 24-hour food recall can be done by open recall (asking and probing for all foods and beverages consumed), or by a list-based method where the enumerator reads a prepared, locally relevant, list of foods and beverages or food groups, and respondent responds only "Yes" or "No". The open recall is more informative and has a smaller error, while the list-based method is easier and faster (1, 3). Open recall is the preferred method for documenting dietary diversity with Indigenous communities. This will also provide more information on the consumption of specific food items, which is useful to understand overall diversity in the diets (e.g., species level) and assess the impact and changes in consumption of particular foods and species.
Conducting 24-h food recall (open recall):
Start the interview by explaining the purpose of the survey and the interview process to each respondent (who should be women aged 15 to 49 years). Always seek free, prior and informed consent. Create a friendly and relaxed atmosphere. Begin the interview questionnaire (Table 2) as follows: "I would like to ask you to recall everything you ate or drank yesterday from the morning until the night. Please mention all foods and beverages you consumed either at home or outside of the home. Please include all foods and beverages, not only main meals but also any snacks, fruits or small meals."
To make the recall easier, supporting questions can be asked: "What did you eat or drink when you woke up yesterday?" After a response, probe "Anything else?". And continue with the same question for midmorning snack, lunch, afternoon snack, dinner, and evening snack.
Always probe to make sure the respondent has not forgotten anything. Indigenous Peoples often consume wild foods (for example a wild fruit consumed while in the field), so probing in this context is particularly important. If the respondent recalls a mixed meal such as soup, porridge, or any other mixed dish, ask to specify all the specific ingredients. Table 2 shows a structured table to collect the 24-hour food recall data.

Analysis at Individual Level
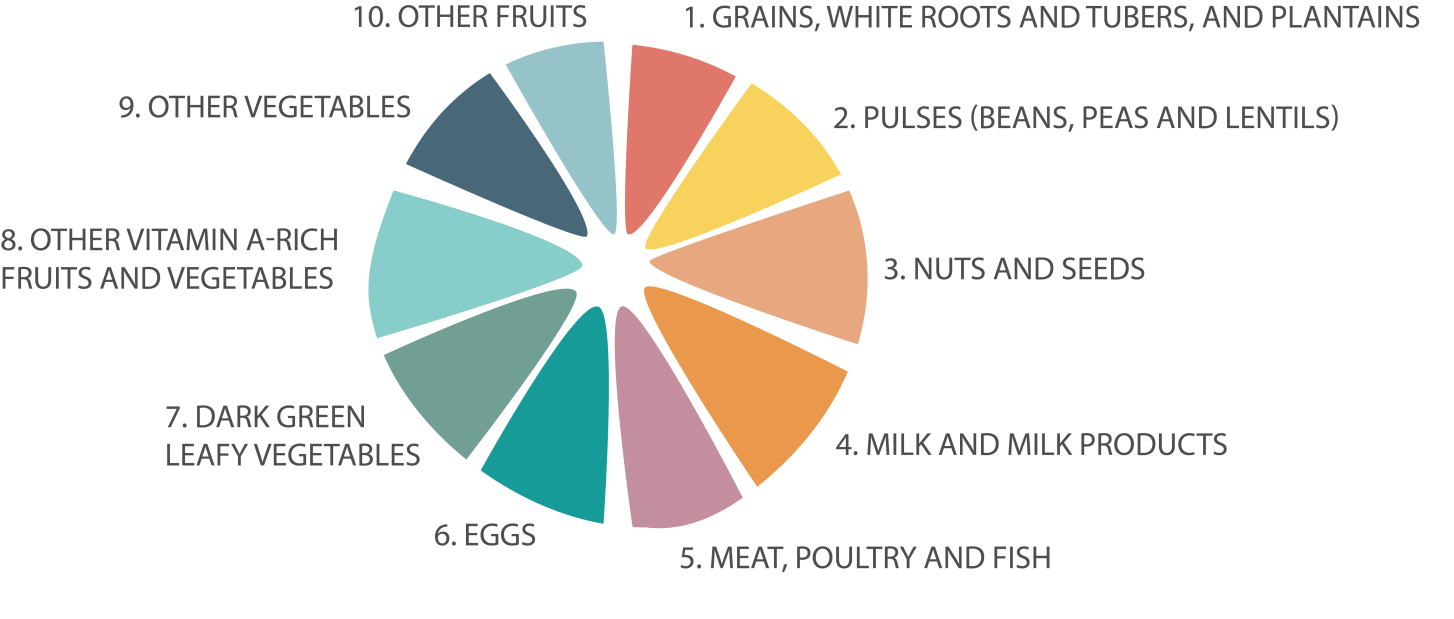
The key step to analysing dietary diversity through the MDD-W indicator is to categorize all the consumed foods into ten standard food groups for each individual. Consumption of at least one food item from any food group counts as one score for that group; then the number of food groups identified is summed. Thus, the MDD-W indicator can range from a score of one to ten. Any ingredient used in quantities smaller than 15 grams (which is roughly one full tablespoon), such as chili pepper or spices, is considered a condiment/seasoning, and thus is not counted as a food group.
Considering the example of the food recall provided in Table 2, the woman consumed five food groups and thus her dietary diversity score is five. Therefore, the woman reached the MDD-W dietary diversity threshold (at least five food groups consumed).
Population-level Indicator
The population-level indicator is the proportion of women reaching MDD-W (% of women who consume at least five food groups). For example, if 40 out of 100 interviewed women consumed at least five food groups, the proportion of women reaching MDD-W is 40%. The mean dietary diversity can also be counted, but the proportion of women reaching MDD-W is a more accurate measure. It is also strategic to analyse the proportion of women consuming particular food groups.
Interventions which increase the consumption of under-consumed food groups as identified by the MDD-W would have the highest potential of increasing dietary diversity. However, the local context and food culture need to be at the centre of any intervention, and sensitivity should be exercised in project implementation, as consumption of certain food groups may not be culturally acceptable or feasible (especially among animal-dependent communities, see Box 4). In this scenario, increasing diversity, consumption frequency, or portion sizes of nutritious foods from already consumed food groups might be more suitable. In this way, diets can be improved even if the dietary diversity indicator does not increase. Dietary diversity findings need to be shared and discussed during the community and stakeholder consultations in STEP 3, where the barriers to and reasons for low consumption of certain food groups can be identified and strategies can be developed.
Lastly, if there are expected significant socioeconomic differences within the community, it is suggested to also collect basic socio-demographic data and compare the dietary diversity findings across different clusters, for example, between women with different livelihood strategies, land-use systems, age, education level, or household wealth. The list of possible socioeconomic and livelihood indicators is available in STEP 4.
Box 3. Example of key results of dietary diversity assessment with Khasi and Garo women in Meghalaya, North-East India.
A survey by NESFAS assessed dietary diversity of 276 Khasi and Garo Indigenous women (15-49 years) and found that 37% of women reached MDD-W (4). The mean dietary diversity was 4.2. The most widely consumed food groups were Grain, white roots and tubers, and plantains (consumed by 100% of women); Other vegetables (89%); and Meat, poultry and fish (79%). The under-consumed food groups were Dark green leafy vegetables (45%); Other vitamin A-rich fruits and vegetables (35%); Pulses (26%); Other fruits (22%); Eggs (17%); Nuts and seeds (7%); and Milk and milk products (1%). The food biodiversity assessment (see STEP 1) helped to prioritize preferred food biodiversity in the under-consumed foods groups, which were then targeted by food, nutritional, and agroecological interventions.
Box 4. Special attention to assessing and interpreting diets of animal-dependent communities:
Although MDD-W is a generic indicator that can be used in different settings, it should be interpreted cautiously in the case of communities with specific dietary patterns such as pastoralists, certain hunters or Arctic people who are all largely dependent on animal-sourced foods. Despite the likelihood that the number of food groups consumed will be lower among these groups, there can be high diversity within animal-based food groups in terms of species and different parts of animals consumed. Different animal parts (e.g., organ meats, blood) tend to be rich in micronutrients that are important for nutrient adequacy. With this in mind, dietary diversity results should be interpreted with cultural sensitivity. A possible adjustment of food groups could be considered, or a deeper assessment of diets and existing food biodiversity could be conducted.
The Maasai Food System
The video on the food system of Maasai People in Olkiramatian Group Ranch demonstrates the cultural and dietary importance of livestock for Maasai People, yet it also shows an integration of cultivated crops and foods from market. In this context, a standard dietary diversity assessment should work well. In addition, the video shows that even in traditionally animal-dependent communities where one would assume that diets are based only on meat, blood, and milk, there is “hidden” food biodiversity such as herbs and wild fruits that are diversifying diets. These natural foods are often overlooked in mainstream nutrition programs. Some of these local plants have been identified as nutritionally or medicinally significant (5).
Literature review: Existing information on dietary diversity (or additional nutritional indicators) can sometimes be found in literature sources such as research articles, reports, country technical notes, theses, etc. However, in the context of Indigenous Peoples, the available information might be rather limited.
Expert interview: Interviewing relevant experts, such as local nutritionists or community health specialists, can provide information on the diets and nutrition of the community. However, such qualitative information is difficult to use for project monitoring (unless there is existing monitoring and data that local experts can provide).
Focus group discussion (FGD): The typical diet, foods, and consumption patterns can also be discussed during community FGDs. FGDs can provide very useful information and raise awareness, but this qualitative information should not be quantified and used for dietary monitoring. It could be sufficient for project design.
Note: At the project design phase, alternative methods such as expert interviews, FGDs, or secondary data reviews might be particularly useful for rapid assessments of diets and nutrition in case there are limited time or resources for an MDD-W survey during the design mission.
It is recommended to consider alternative indicators where MDD-W does not apply due to the limited diversity of foods consumed. IFAD also adopts as a core outcome level indicator the Knowledge, Attitude and Practice (KAP) nutrition indicator. Additional indicators are suggested at the end of this chapter. It should also be noted, that in addition to the IFAD core indicators, at the project level, there is the possibility and flexibility to integrate other relevant indicators, as long as they can be adequately managed in the logical framework.
Other Data Collection Methods
Although not explained here, with available resources and time, it is possible to collect additional data and look into other indicators based on quantitative food intake, repeated 24-h food recalls to capture seasonal differences, anthropometric surveys, or biochemical markers. See for example FAO (2018) (6), or Cambridge Biomedical Research Centre (n.d.) (7). A deeper understanding beyond dietary diversity would be helpful, particularly for assessing diets of communities with specific diets such as animal-dependent communities (Box 4).
Whenever possible, besides categorizing foods into food groups, an additional important step would be to review the actual composition of local foods in food composition tables, or determine the nutrient content of these foods by laboratory analysis. This would help to identify and promote the most nutrient-dense species and foods.
Barrier analysis: Barrier analysis is a formative survey that is used to identify what is preventing the target group from practising a desired behaviour, as well as what are the enablers of that behaviour (8). Barrier analysis allows groups to look beyond preconceptions and identify the real barriers and their determinants in order to design an effective behaviour change strategy. For example, barrier analysis with Pnar (subgroup of Khasi Indigenous Peoples in North-East India) women and adolescent girls found that significant barriers to the consumption of diverse local foods were crop pests and diseases damaging food production, the influence of friends on dietary choices, and lack of awareness on the linkages between diet and health (9). See Kittle (2013) (8) for guidance on conducting barrier analysis. Due to feasibility matters, key barriers can be discussed alternatively during stakeholder consultations (see Table 4 in STEP 3).
Dietary species richness: Data collected in STEP 2 can be analysed using an indicator called Dietary Species Richness (10). This indicator, which counts the number of different species consumed per day, is also positively associated with dietary adequacy. It can be a suitable measure of food biodiversity in the diets of Indigenous Peoples. The main challenge is the additional need to distinguish and count all different species consumed by the respondents. In the example of the food recall given above, the respondent consumed 12 species, and thus the dietary species richness is 12 (tea, sugar, and salt are not counted, but condiments and spices are considered).
Consumption of ultra-processed foods: A further analysis tool that can be integrated in the MDD-W template is to calculate the proportion of ultra-processed foods in the diet. Consumption of ultra-processed foods is linked with increased non-communicable diseases, overweight, obesity, and mortality (11). The overall dietary advice should guide consumers to eat a diverse, healthy diet dominated by minimally processed foods and avoidant of ultra-processed foods. This pattern strongly corresponds with traditional diets based on local foods. But traditional diets are changing rapidly, and monitoring consumption of ultra-processed foods could help to capture the extent of dietary transition and inform communities, programs, and policies.
To calculate the proportion of ultra-processed foods in the diet, the first step is to categorize the consumed foods into food groups using the NOVA classification system (12). These are: 1) Unprocessed or minimally processed foods; 2) Processed ingredients; 3) Processed foods; and 4) Ultra-processed foods. All the food items are given the same weight, and the share of ultra-processed foods in diets is counted (the number of consumed ultra-processed food items is multiplied by 100 and divided by the total number of food items consumed). Considering the example of the food recall in Table 2, the woman consumed a total of 23 items and one item was ultra-processed (chocolate biscuit). Therefore, 1*100 / 23 = 4.3. This means that the share of ultra-processed food items in the woman's diet is only 4.3%, and the share of non-ultra-processed food items is 95.7%.
List of foods and ingredients consumed: Since the open recall method of 24-hour food recall provides information on various food items and complex foods consumed, it is possible to create a list of local dishes, including their ingredients. This can help to highlight how diverse the foods are, what biodiverse foods could be promoted, or how the recipes could be adjusted and diversified.


Made with
Drag & Drop Website Builder