Mapping the way to a better future
IFAD Asset Request Portlet
Asset Publisher
Mapping the way to a better future
Estimated reading time: 3 minutesMaps reveal a lot. They chart the flow of rivers, the highest peaks, the sprawl of cities and the boundaries between countries. Compared over time, maps also reveal how things change — and how development is helping rural communities prosper. A road is a path to new customers, a well is a source of water for growing farms, a forest is a source of fuel and income.
Here are four ways IFAD creates maps using Geographic Information Systems (GIS) to plan activities and measure results and to monitor whether funds are being used efficiently to lift rural people out of poverty.
1) Plan and measure progress
Rural development projects — like roads, irrigation schemes and markets — can be mapped with GIS to gain insight into a project’s activities and impact. By tagging the location of investment sites, it is easy to see where activities are taking place and where more investment may be needed.
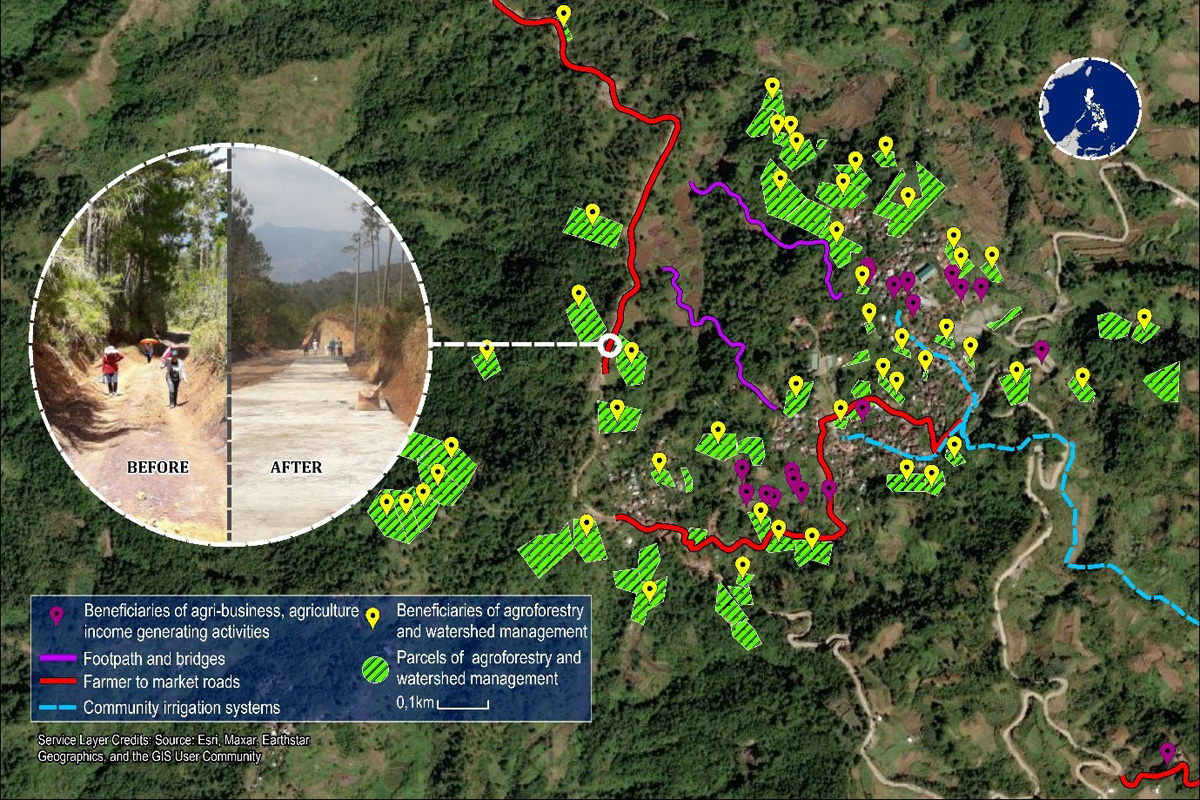
The CHARM II project active between 2008 and 2021 supported indigenous farming communities in mountainous areas in the Philippines by promoting agroforestry, and building irrigation systems and roads.
This map shows project activities in a village in the Philippine’s Mountain Province. In this case GIS contributed to the successful implementation of the projects, allowing farmers quicker access to their fields (the green parcels) and markets, thanks to the new roads (the red lines), footpaths and footbridges (the purple lines).
 |
| Mapping project activities in a village in the Philippine’s Mountain Province. © IFAD |
2) See change happen
Location-specific data can be overlaid with satellite imagery and other information, such as the location’s climate history or population figures and these can be used to assess if a project has caused a positive change or whether more needs to be done.
In southern Mexico, the Community-based Forestry Development Project aims to stop deforestation and promote the sustainable use of forests. In the state of Campeche, where communities own large forested areas, project activities focused on strengthening the sustainable use of forest resources.
In this map, GIS was used to compare the vegetative health of forests that were part of the project (shown as green parcels on the web-map) with those that were not (shown in red). Forests that were part of the project were found to be healthier and more resilient to droughts and other climate shocks.
3) Map (and prevent) risks
Mapping project activities helps to identify and mitigate risks and adverse impacts. This can include analysing the proximity of project sites to legally protected areas (such as national parks) or disputed areas, so as to avoid conflict.
4) Be on the same page

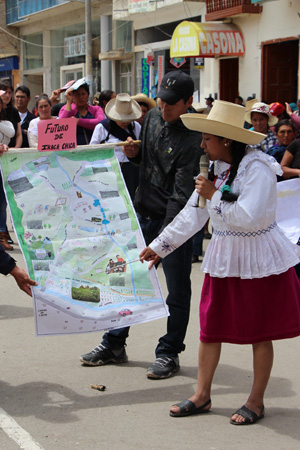
In the Sierra y Selva Alta Project in Peru smallholder farmers made use of maps to showcase the project and its future targets. The project, funded by IFAD and the Peruvian government, ended in 2019 and benefitted almost 40,000 rural families and helped farmers mitigate the impact of climate change.
From valleys and mountains, to forests and field crops, GIS should play a key role in how we plan projects. IFAD understands the importance of mapping, and continues to seek ways to systematically integrate these tools to ensure that project managers and their team members can work as efficiently as possible, in order to benefit rural communities.
Read more about how to use GIS for monitoring and evaluation.
Publication date: 26 September 2022